Author: ORNL DAAC
Date: April 21, 2019
Contact for ORNL DAAC: uso@daac.ornl.gov
Keywords: Web service, Python, Open Geospatial Consortium (OGC), REST API, MODIS, Daymet, Spatial Data Access Tool (SDAT)
The ORNL DAAC (Oak Ridge National Laboratory Distributed Active Archive Center) for Biogeochemical Dynamics is a National Aeronautics and Space Administration (NASA) Earth Observing System Data and Information System (EOSDIS) data center managed by the Earth Science Data and Information System (ESDIS) Project.
The ORNL DAAC offers many tools and services for visualization and access to data, which will be demonstrated in this tutorial.
The Web services used in this tutorial include:
- MODIS Web Service, a REST Web service, to access MODIS Land Products
- Daymet Single Pixel Tool, a REST web service to access daily weather parameters offered in the Daymet data product at a single geographic point
- Spatial Data Access Tools (SDAT) offers OGC-based REST Web services to visualize and download spatial data in various user-selected spatial/temporal extents and formats. The SDAT is a general-purpose Web application. It contains 187 archived data products (as of April 2019) in many science disciplines, including agriculture, biosphere, climate, land surface, etc.
- Web Map Service (WMS): Get maps (i.e., visualization) of geospatial data from a remote server
- Web Coverage Service (WCS): Download geospatial data from a remote server
With both OGC WMS and WCS, you can customize maps for the data you need. For example, you can choose the spatial region, the data and map format (e.g., GeoTIFF for WCS; PNG for WMS), the coordinate reference system or projection, and the resolution.
In this tutorial, we will use several Web services to access and combine datasets near Fairview Curve at Rocky Mountain National Park in Colorado (latitude = 40.399391, longitude = -105.835901) to investigate tree mortality owing to bark beetle infestation from 2006-2010.
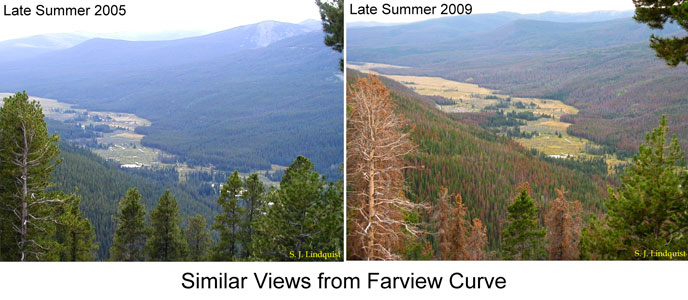
The photos above were taken in late summer in 2005 (left) and 2009 (right), and illustrate the effects of bark beetle infestation. One way to quantitatively access the impacts of bark beetles on tree mortality is to use a vegetation index, which indicated the health of vegetation.
Data products used in theis tutorial include:
- MOD13Q1: MODIS (Collection 6) 16 day Enhanced Vegetation Index (EVI) at 250 m spatial resolution.
- Accessed through MODIS Web service
- Daymet: Daily total precipitation and daily maximum/minimum temperature at 1 km spatial resolution.
- Accessed through Daymet single pixel Web service
- Tree Mortality from Bark Beetles: yearly total tree motality (in Mg C km2) at 1 km Resolution in the western USA for 2003-2012
- Accessed through SDAT OGC WMS and WCS
Python 2.7 or later and modules: numpy, pandas, matplotlib, urllib, zeep, owslib, datetime, modisViirsClient
Click the following link to access the Jupyter Notebook web_services_data_access.ipynb.