FinnStonks Personal Equity Portfolio Monitor provides a web-based, customizable, simple, compact, clean overview of the current state of your equity portfolio for daily monitoring as well as following prices of stocks that you are interested in. In spite of being interactive (switch UI content by clicking), it is designed to be a static screen that does not require user action by default.
FinnStonks is a hobby project for my own personal purposes and not really a polished product. It is publicly here only in case anybody finds it useful as is or is interested in developing it further. It is not developed to serve the general public, and probably best suited for European sunday micro-investor hobbyists alike, who don't do trading on regular basis with large capitals, but are still interested in keeping an eye on their assets on a daily or weekly basis.
See CHANGELOG.md for most recent changes, that may not be described on this page yet.
In short, FinnStonks takes your stock purchases, stock sales and interesting companies like this:
# BUYS
SAA1V:FH;   2020-02-12;      35;     12.85
MSFT:US;    2020-04-20;       4;    147.49
BOREO:FH;   2020-06-15;     100;     14.92
SSH1V:FH;   2020-08-04;     121;      1.33
TSLA:US;    2020-09-01;       5;    420.00

# SELLS
TSLA:US;    2021-01-28;       4;    682.21

# LOOKOUT
LI:US
NIO:US
...and turns them into this:

Trade events may also be completely imaginary, in case you want to test your skills before starting to invest.
FinnStonks cannot be run via file:/// protocol (i.e. it will not work if you drag and drop index.html to your browser window). You need to run a HTTP Daemon on localhost or place FinnStonks on an SSL secured web server.
- Clone or download this repository.
- Replace the example lists in
stocks.txtwith a list of your own, actual purchase and sale events: instructions. - Obtain required (free) API key: instructions.
- Open
finnstonks.jsin a text editor, paste your API key in there and change any of the settings you wish. - Run your HTTP Daemon (such as http-server) or upload files to an SSL secured web server.
- Whenever you perform a purchase or a sale, just add it to the corresponding list in
stocks.txt.
#protip: Host stocks.txt in Dropbox for easy updating.
If your copy of FinnStonks is located on a web server, you may ease the updating of stocks.txt by hosting it separately in your Dropbox, thus giving access to editing the trades txt directly on your computer. Any other such cloud storage file sync apps are currently untested, but may work just as well (as long as it can produce an URL to the raw file with required CORS headers).
- Place
stocks.txtsomewhere in your Dropbox. - Right-click it and select Copy Dropbox Link.
- Edit
finnstonks.jsand locate linevar tradeEventsTxt = 'stocks.txt';somewhere at the beginning. - Replace
stocks.txton that line with the Dropbox Link from your clipboard and save.
End result should look something like this:
var tradeEventsTxt = 'https://www.dropbox.com/s/b666pwrytk1pepm/stocks.txt?dl=0';
- Used APIs and how to obtain required API key (free)
- Your trading data
- User interface and how to use it
- Motivation
FinnStonks uses two free APIs:
- Exchangerate.host for up-to-date real-time currency conversion as provided by European Central Bank.
- Bloomberg's Market and Financial News API for up-to-date real-time stock prices.
Bloomberg's API was chosen for stock data for a few reasons probably worth mentioning:
- It contains multiple exchanges worldwide, most importantly Nasdaq Helsinki and Nasdaq First North.
- It supports fetching market information of multiple companies with a single call, which is pretty neat if you're on the Freemium plan with limited 500 monthly API calls.
Bloomberg's Market and Financial News API requires an API key.
Register for a RapidAPI account and subscribe to Bloomberg Market and Financial News API to obtain required API key.
Copy and paste API key to the beginning of finnstonks.js:
// rapidapi.com API key
rapidApiKey = 'PASTE YOUR RAPIDAPI.COM API KEY HERE';
At the time of writing this, Bloomberg's API is available for a Freemium plan, allowing 500 monthly API calls free of charge. If you want to do more detailed monitoring, a paid plans is required.
FinnStonks optimizes API calls and consumption is highly dependant on your settings. 2-4 API calls are consumed per pageload/refresh per 10 different stocks you have in stocks.txt. To consume least API calls (1 per 10 stocks), set all options regarding price history and chart generation to between 1 week and 1 year (w1, w2, m1, m3, m6, y1). Setting any of them to 3 days (d3) will consume additional API call per pageload/refresh per 10 stocks, and setting any of them to 3 years or 5 years (yearsBack >= 3) will consume additional API call per pageload/refresh per 10 stocks.
This means you can refresh FinnStonks about 8 times a day (once every every 3 hours) if your list contains 10 different stocks or less and you have your options set to consume least API calls (1 week - 1 year). If you have 11 or more different stocks in your list, half these numbers.
FinnStonks uses a simple stocks.txt file that should contain all your purchase and sale events in a simple delimiter-separated format.
Each line should read <symbol:exchange>;<date purchased/sold>;<number of shares purchased/sold>;<purchase/sale price of 1 stock>.
All additional fees regarding purchase or sale events should be calculated in the price per stock value.
Purchases and sales are separated by one empty line. Lines beginning with character # will be ignored, in case you want to play around with the data or ignore certain events for whatever reasons.
Pay attention that
- the
# BUYS,# SELLSand# LOOKOUTlines stay in place, even if you have no entries under them. - the empty lines between these sections stay in place.
- there is no empty line in the beginning or the end of the file.
Example:
# BUYS      event date      pcs      price
SAA1V:FH;   2020-02-12;      35;     12.85
MSFT:US;    2020-04-20;       4;    147.49
BOREO:FH;   2020-06-15;     100;     14.92
SSH1V:FH;   2020-08-04;     121;      1.33
TSLA:US;    2020-09-01;       5;    420.00

# SELLS (optional, but keep this line in place)
TSLA:US;    2021-01-28;       4;    682.21

# LOOKOUT (optional, but keep this line in place)
LI:US
NIO:US
You can safely ignore anything under this title, if you don't know what it means.
Most of the UI is configurable simply by clicking on things, even though there are a number of hard-coded settings in the javascript file (see Settings). To keep the UI as clean and simple as possible, I have opted not to include much descriptive information on the UI: See user interactions for what is actually displayed on the table by default and what are the options.
-
jQuery
-
Chart.js
-
Chart.js Annotation Plugin
-
Moment.js
-
LESS (demo only, you may use any styling methods)
-
Bootstrap (demo only, you may use any or no framework)
All prerequisites have been linked from CDNs.
All styling is freely customizable in finnstonks.less. You may use regular CSS or any styling you like,
modifying it should be pretty straight-forward.
finnstonks.js contains a number of settings at the beginning of the file. Most should be pretty self-explanatory. Some settings that may not be self-explanatory:
var includeCashouts = true|false: set to true if you want to take into account profits or losses you have made with previously owned stocks, that you have completely cashed out and no longer own. If false, any such assets are ignored in all calculations.var effectiveDate = 'first'|'last': date to display if you have purchased shares of the same company on multiple occasions.var alarmLimit = -1: limit used to determine how many percent a stock can drop every day for 3 consecutive days before alarm styling is triggered.var refreshInterval = 240: interval in minutes in which everything on page is auto-refreshed using real-time market prices. Set to999999or so if you don't want the page to auto-refresh at all.var refreshDuring = [16, 23]: hours of day between whichrefreshIntervalis active. With this you can save on API call consumption by limiting auto-refresh to only hours when you usually need the real-time price information (e.g. exclude night time if you sleep).var defaultChart = 'sincePurchase'|'3d';: Chart that is shown by default upon pageload (providinggenerateChartsistrue).var colorDownhillTicks = true|false;: Color tick in the chart red if price has come down since last tick. Otherwise only ticks below purchase price are red.
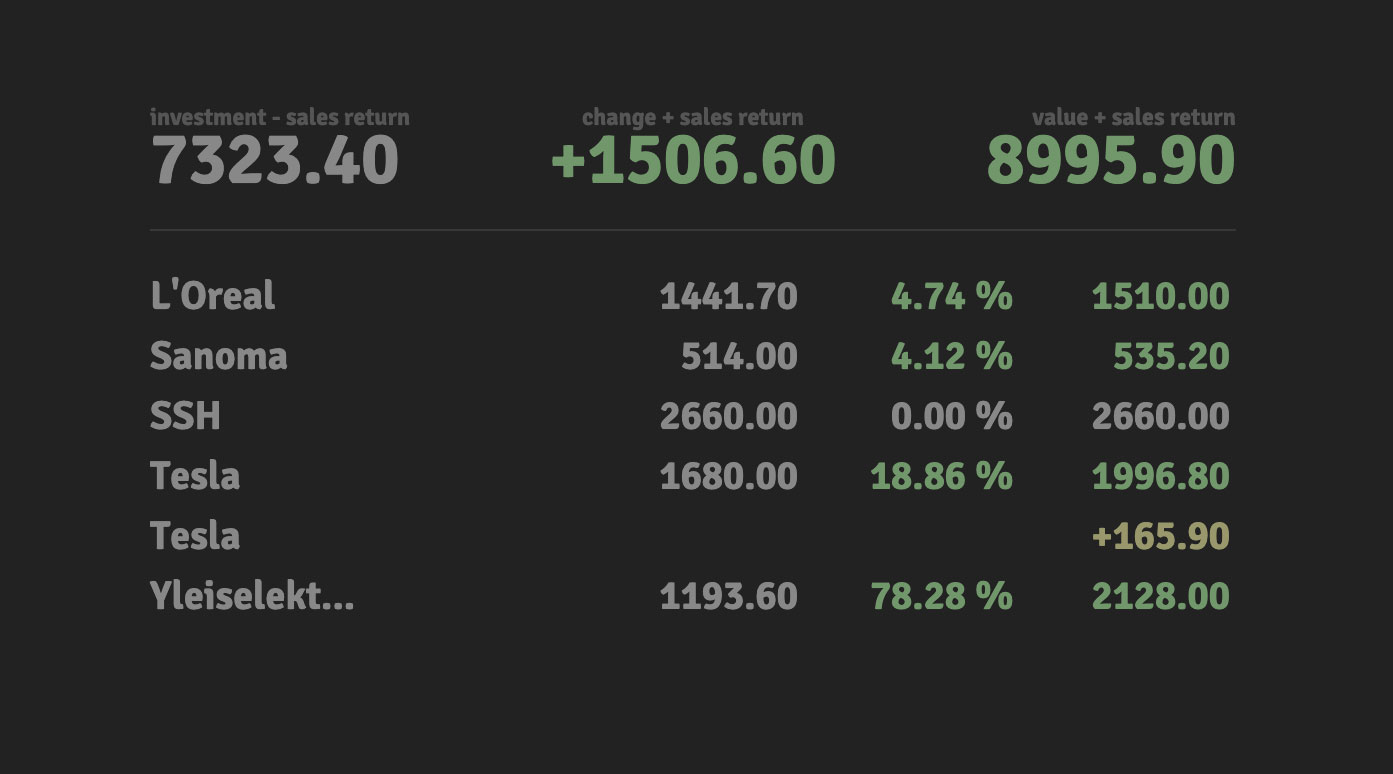
veryCompact set to true, showCashouts set to true, everything clickable clicked once, to change what information is displayed.
Most of the UI is configurable simply by clicking on things.
1. Click on investment total value (top left) to toggle between:
- total euros invested. (Default)
- total euros invested minus any previous sales profits/losses (current true cash loss).
2. Click on change value (top center) to toggle between:
- portfolio value change in euros. (Default)
- portfolio value change plus any previous sales profits/losses in euros.
- portfolio value change in percentage.
3. Click on the portfolio value (top right) to toggle between:
- portfolio value in euros. (Default)
- portfolio value in euros plus any previous sales profits/losses
- previous sales profits/losses only (no portfolio value)
4. Click on the second column to toggle between:
- euros invested. (Default)
- euros invested minus any previous sales profits/losses (current true cash loss).
5. Click on the third column to toggle between:
- from purchase price to latest price, change in euros. (Default)
- from purchase price to latest price, change in percentage.
6. Click on the fourth column to toggle between:
- from purchase price to latest price, change in percentage. (Default)
- current total market value.
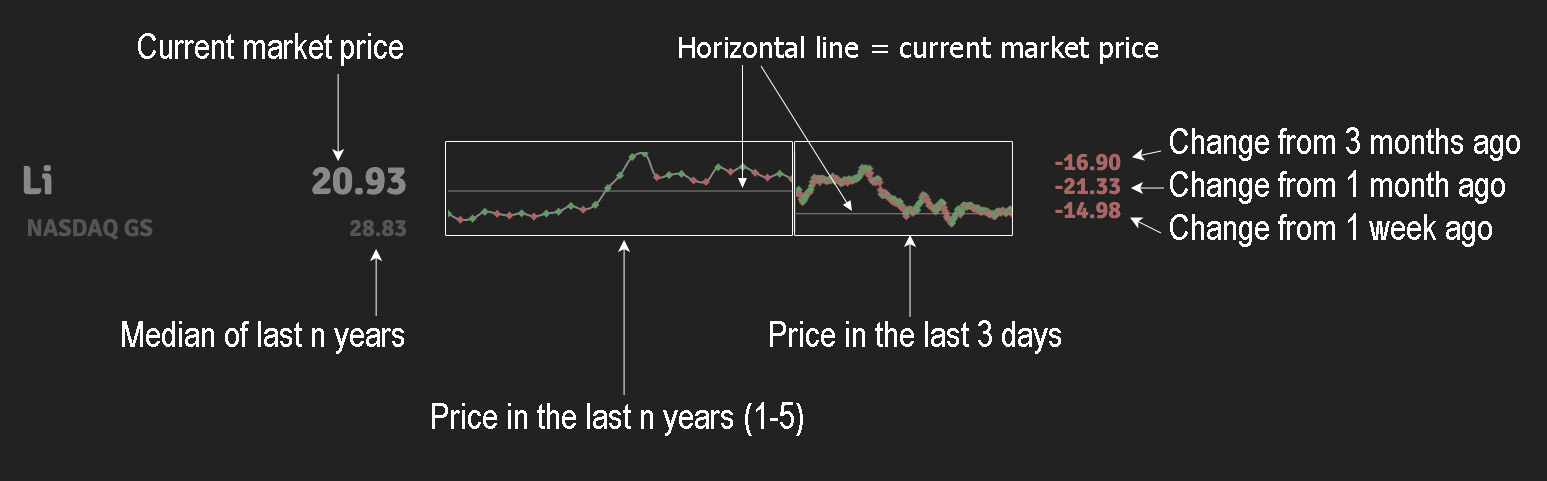
7. Click on the last column to toggle between:
- Default price chart. (Default)
- Secondary price chart (history from
yearsBackyear(s) ago). - price changed between now and each of
displayChangesoption.
In the price charts, horizontal grey line indicates the price you paid.
Press Q key on your keyboard and use the search field to find the correct tickers to add new stocks to stocks.txt.
There are countless stock market monitors out there that enable you to follow stock prices of your choosing. However, apart from the platform you've used to purchase your assets, very few seem to provide any ability to follow stock prices even as if existing assets (number of stocks, starting point). Even fewer an entire equity portfolio containing multiple companies, not to mention taking into account any further trading events, doing any calculations or customizing layout or the data shown. Furthermore, one may do different tradings on different platforms and lose the overview of the whole.
Hence an Excel spreadsheet is still a good friend of any stock investor. The purpose of FinnStonks is to replace all that hassle with an automated, clean, browser-accessible screen. All you do is add the event to the bottom of the list when you've purchased or sold some stocks in spite of the used platform.